Since coming back from Washington D.C., I jumped right back into the routine. We had two midterms to study for. One in Science of Diet and Nutrition and the other in Medical Microbiology II. Thursday morning was our nutrition midterm, we were tested on electrolyte function in the body, physiological response to different types of food, eicosanoids, and the cumulative effect diet has on inflammation in the body. I am happy to say I earned the highest grade in the class. Medical Microbiology was not as easy for me but I still did OK on it. After my exam on Friday, I attended open adjusting lab and worked on my manipulative skills. I was excited to achieve my first cervical spine adjustment thanks to Dr. Petrocco-Napuli and Dr. Freeman. I learned a new thoracic adjustment and practiced my lumbar adjustments as well.
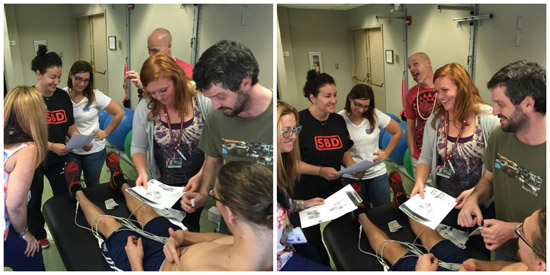
Following open adjusting lab we had our cardiovascular physiology lab. My classmates and I got to use the electrocardiogram also known as ECG and EKG. I volunteered as the subject for the ECG, and I must say it was a really cool lab. In class we have been discussing electrical conductance of the heart in correspondence with filling and contraction of the heart. If you have ever seen any medical television show or movie, you have most likely seen an ECG and called it a heart monitor. It displays the depolarization and repolarizations of the cardiac muscle cells of the Atria and ventricles. There are three waves to observe in a healthy patient’s ECG. Those waves are the P wave, QRS wave, and T wave.
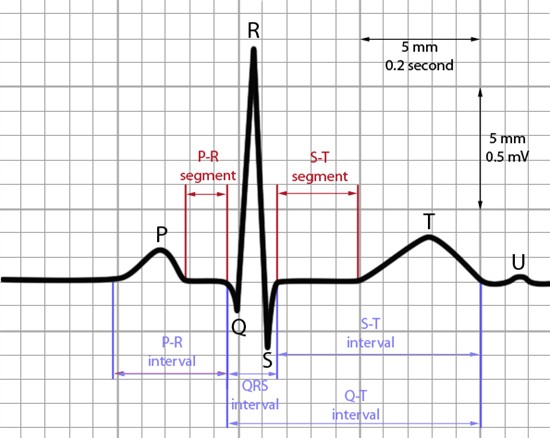
Atrial contraction follows the P wave. The sound is actually the closing of the valves between the atria and the ventricles. The ventricular contraction follows the QRS wave and the sound is also caused by the closing of the semilunar valves. My classmates attached the electrodes to my body in specific areas. Once all the electrodes were stuck on, we attached the leads.
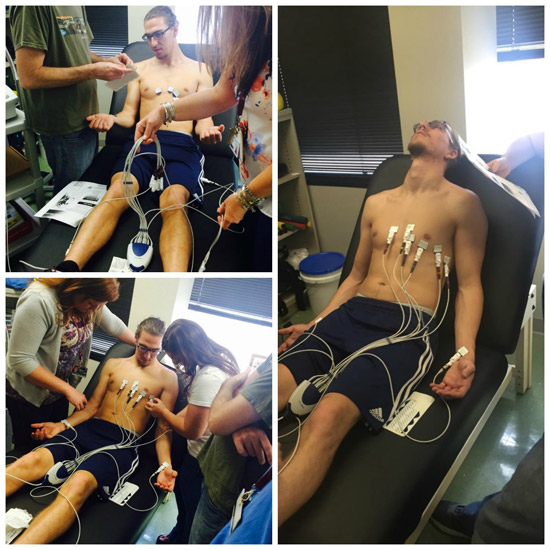
We turned the machine on which gave us feedback about the leads and whether any signals were not being detected. Once we fixed the discrepancies, we ran the machine. The ECG printed out a report that displayed the electrical conductance of my heart. It measured my heart rate and the intervals between each wave. It also gave a full diagnostic report stating whether my heart was normal or abnormal.
Everything looked good! It was a lot of fun learning how to use the ECG machine as well as what the data means. We learned how to understand what those lines mean physiologically in order to make an accurate diagnosis. I am happy we have access to the same technology other medical professionals use every day in practice.
Thanks for reading, if you have any questions, please feel free to email me ([email protected])